A short tutorial about how to use the principal steps in CATIA Analysis and simulation -> General Structural Analysis module. It is simple now to find the limit of materials and how to make a part without resistance problems.
1.The first step is to Open or Create the part that you want to be simulated.
2. Now you should apply a material, in my case Steel. Is very important to apply a material because without this you can`t run the simulation.

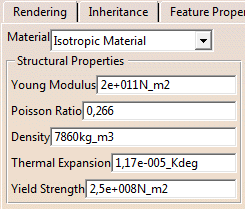
A very important thing that you must know is to find the Proprieties of a material. To find the material proprieties in CATIA you should double click on your material selected on the Tree and go to Analysis Tab.
3. Open the CATIA Analysis and simulation -> General Structural Analysis module from Start Menu and select Static Analysis and click OK.
4. Now you can see the appearance of an icon close to the part that reflects a representative “size” and “sag”. The size is represented with green and the sag with blue. The explanation of these elements is: a smaller element size lead to more accurate results at the expense of a larger computation time. The “sag” terminology is unique to CATIA. A smaller “sag” value could lead to better results. To change the value of these two elements you can double click on OCTREE Tetrahedron Mesh or double click on the elements that appear on the part.

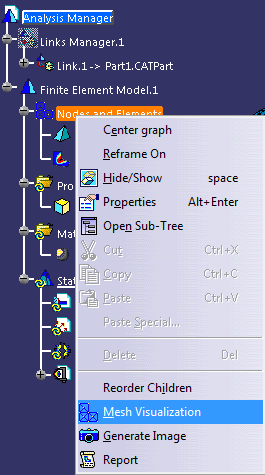 To see the Mesh go to the Tree -> Finite Element Model.1 -> Right click on Nodes and Elements and click Mesh Visualization.
Note: I have some more points regarding the mesh size. As indicated earlier, a smaller mesh could result in a more accurate solution; however, this cannot be done indiscriminately. The elements must be small in the regions of high stress gradient such as stress concentrations. These are areas where the geometry changes rapidly such as bends, fillets, and keyways. Uniformly reducing the element size for the whole part is a poor strategy.
Regularly save your work.
5. Applying Restraints in CATIA analysis and simulation
CATIA`s FEA module is geometrically based. This means that the boundary conditions cannot be applied to nodes and elements. The boundary conditions can only be applied at the part level. As soon as you enter the Generative Structural Analysis workbench, the part is automatically hidden. Therefore, before boundary conditions are applied, the part must be brought to the unhide mode. This can be carried out by pointing the cursor to the top of the three, the Links Manager.1 branch, right-click, select Show.
In FEA, restrains refer to applying displacement boundary condition which is achieved through the Restraint toolbar. The Clamp conditions mean that the displacements in all three directions are zero.
In my case I use the Clamp for below face of part.

6. Applying Loads
In FEA, loads refer to forces. The Loads toolbar is used for this purpose. Select The Distributed Force icon, and with the cursor pick the face that you want to be loaded. When you put the force be attention when you chose the direction of it. In my case, because the front face is not in total contact with my force, I made in Part Design module a simple Pad, with 10 mm larger than the hole with only 0.001 mm thickness (to not influence the main part). My Distributed force is -100 N.

7. Launching the Solver (Compute)
To run the analysis, you need to use the Compute toolbar by selecting the Compute icon. In the Compute box leave the defaults as All which means everything is computed. Tip: if the estimates are zero in the listing, then there is a problem in the previous step and should be looked into.

8. Postprocessing
The main postprocessing toolbar is called Image.
To view the deformed shape you have to use the Deformation icon. The resulting deformed shape is displayed below. The deformation image can be very deceiving because one could have the impression that the wrench actually displaces to that extent. Keep in mind that the displacements are scaled considerably so that one can observe the deformed shape.

Displacement – is available on Image toolbar. The default display is in terms of displacement arrows as shown on the right. The color and the length of arrows represent the size of the displacement. The color legend indicates a maximum displacement of 0.00434 mm.

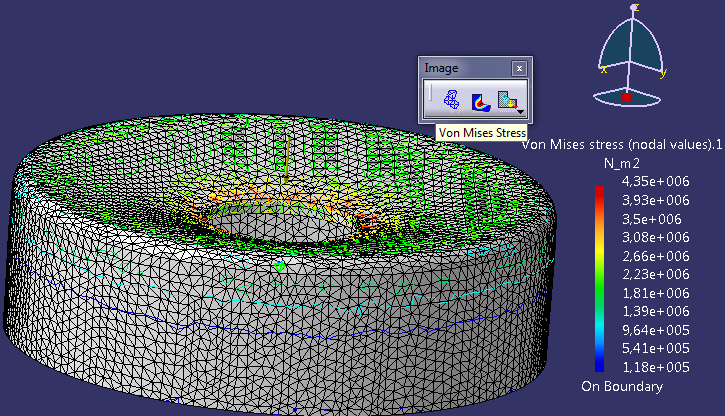
Von Mises Stress is also on Image toolbar. The von Misses stress is displayed to the right. The maximum stress is 4.35E+7 N_m2 which is below the yield strength of most steels (see Proprieties of a material image table).
In conclusion, my part is ready to be used without any problem.
9. When you want to save Part and Analyze you should use Save management.
nice
NIce Short and quick start to Generative Structural Analysis!
Thanks!
Very nice post, thanks.
I’ve been doing this in a couple simple pieces and have quite the same images like this post, but my doubt is why the Von Mises Stress is shown in lines and not in full color areas?
Are there any parameters to adjust to have those areas visualized?
Thanks in advance.
I had the same doubt. You need to change the render style to show the Material .
Hello Admin
Thanks for the interesting tutorial
Actually, I have an inquiry about analysis in CATIA
When I insert a deep grove ball bearing and make the computation after putting the restrains and loads, I got an error message that said that ” Singularity detected in translation”
Please if you have any tutorials about ball bearing in analysis, I will be so appreciate
Thanks in Advance